This is not a “one and done” sector idea, just a speculation that may be of interest.
I regularly write about cycles, and in this post back in January I noted cycles in LL Flooring (NYSE: LL) - formerly Lumber Liquidators.
I’ll open a position in LL when it’s back above $3.00 and I’ll add to that position when my timing indicators signal bullish.
Both conditions are likely soon. LL closed today at $2.90
On Wednesday November 1st LL will issue its quarterly earnings report. We can expect significant volatility on that date if history is any indication.
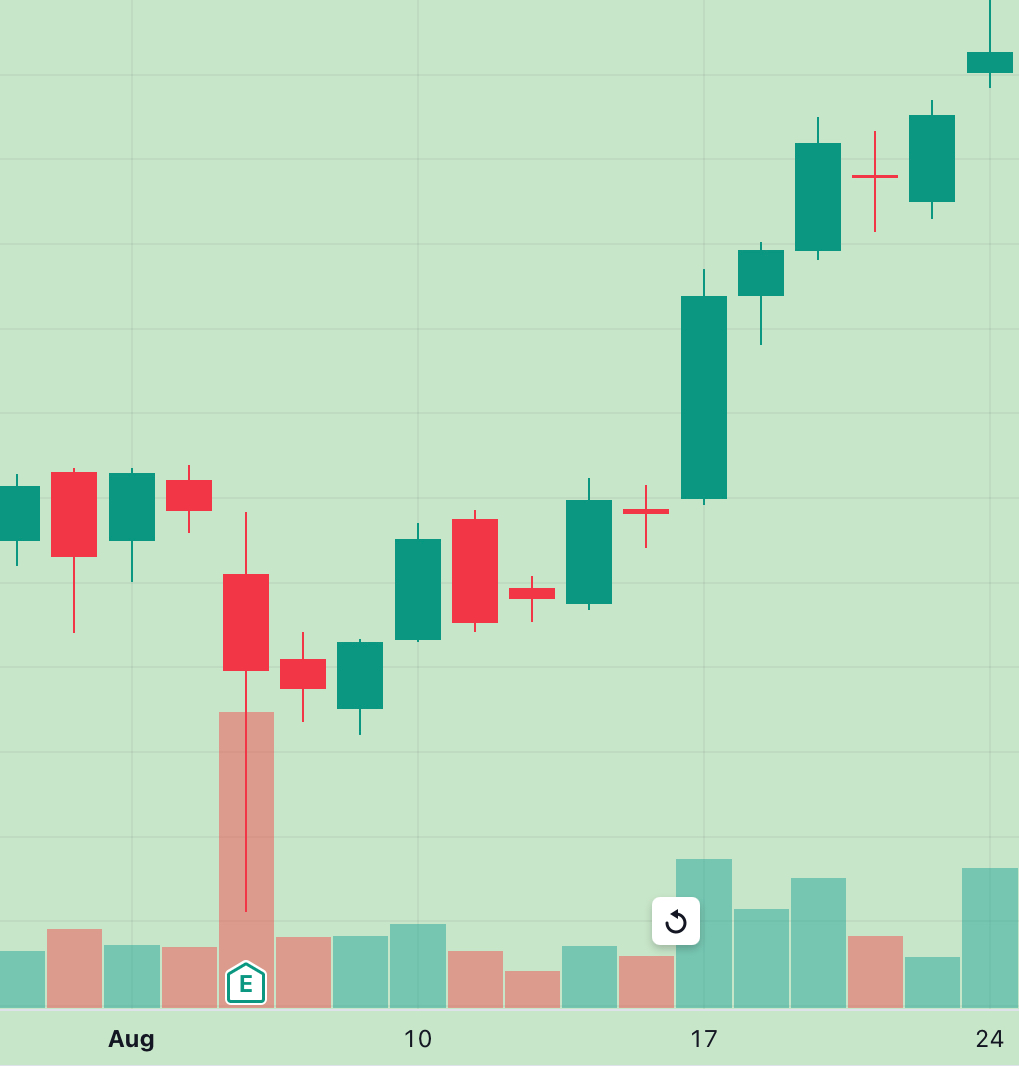
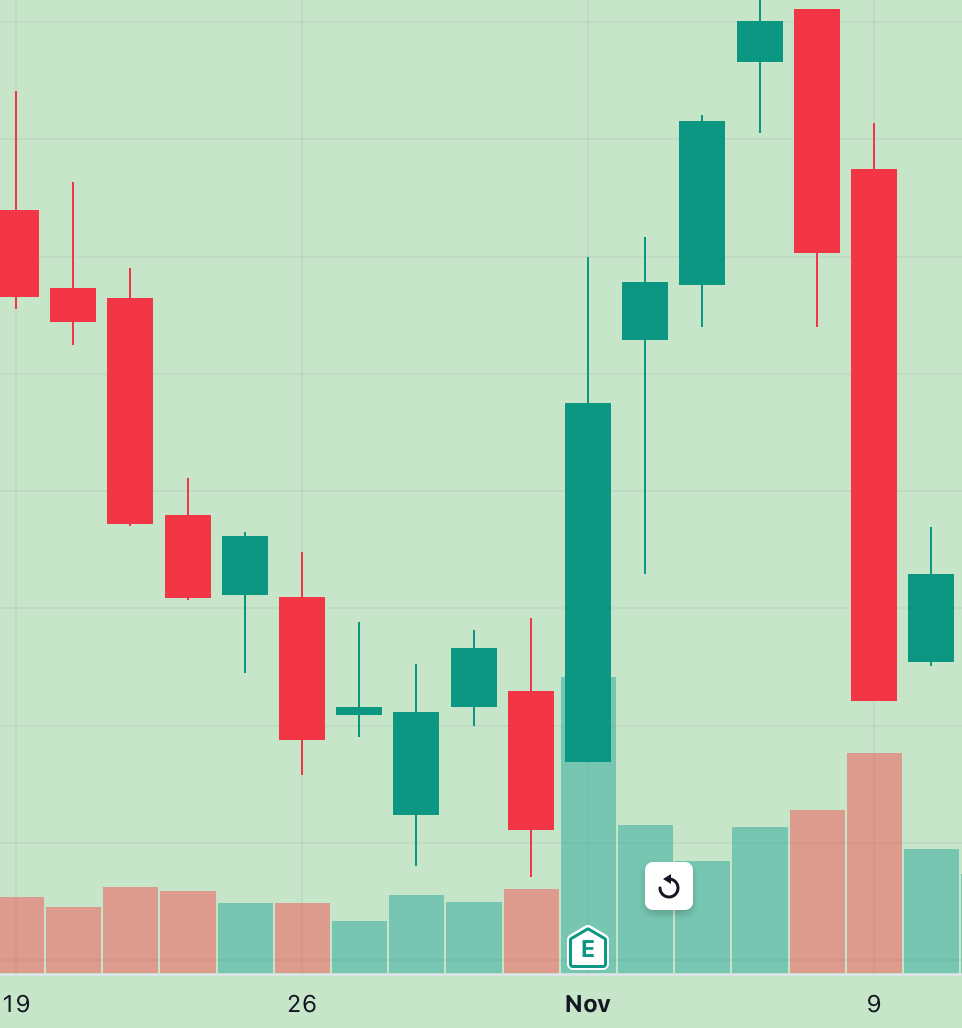
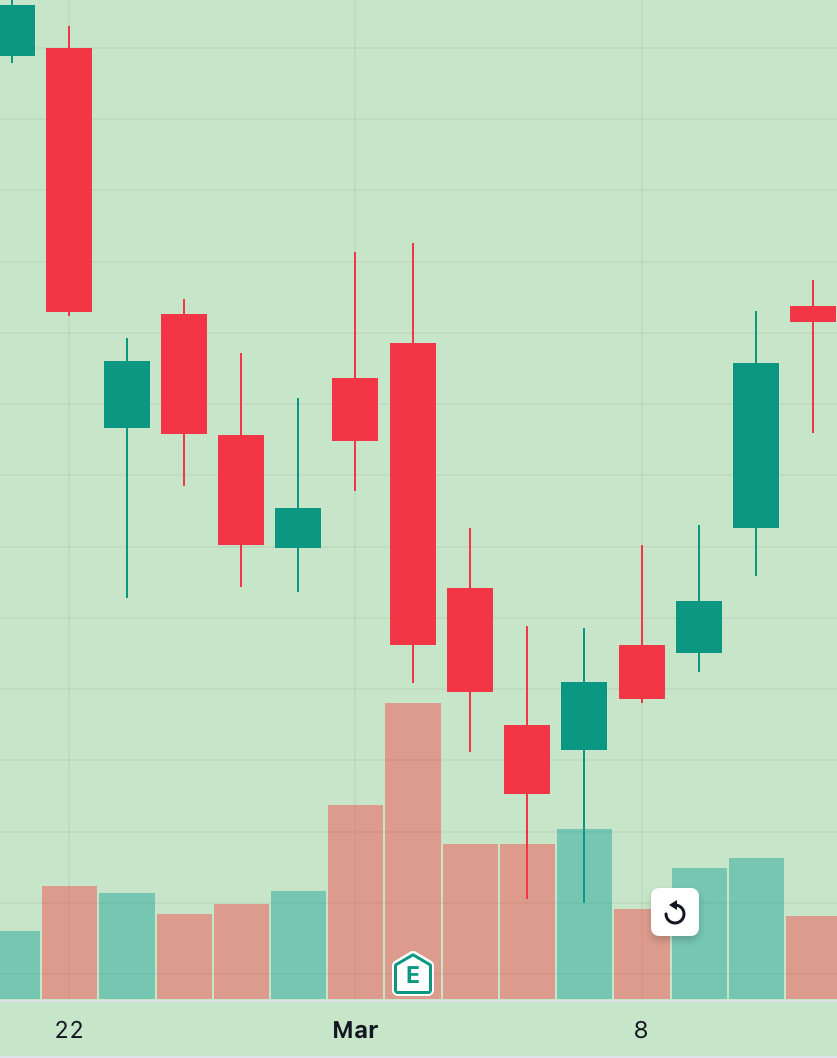
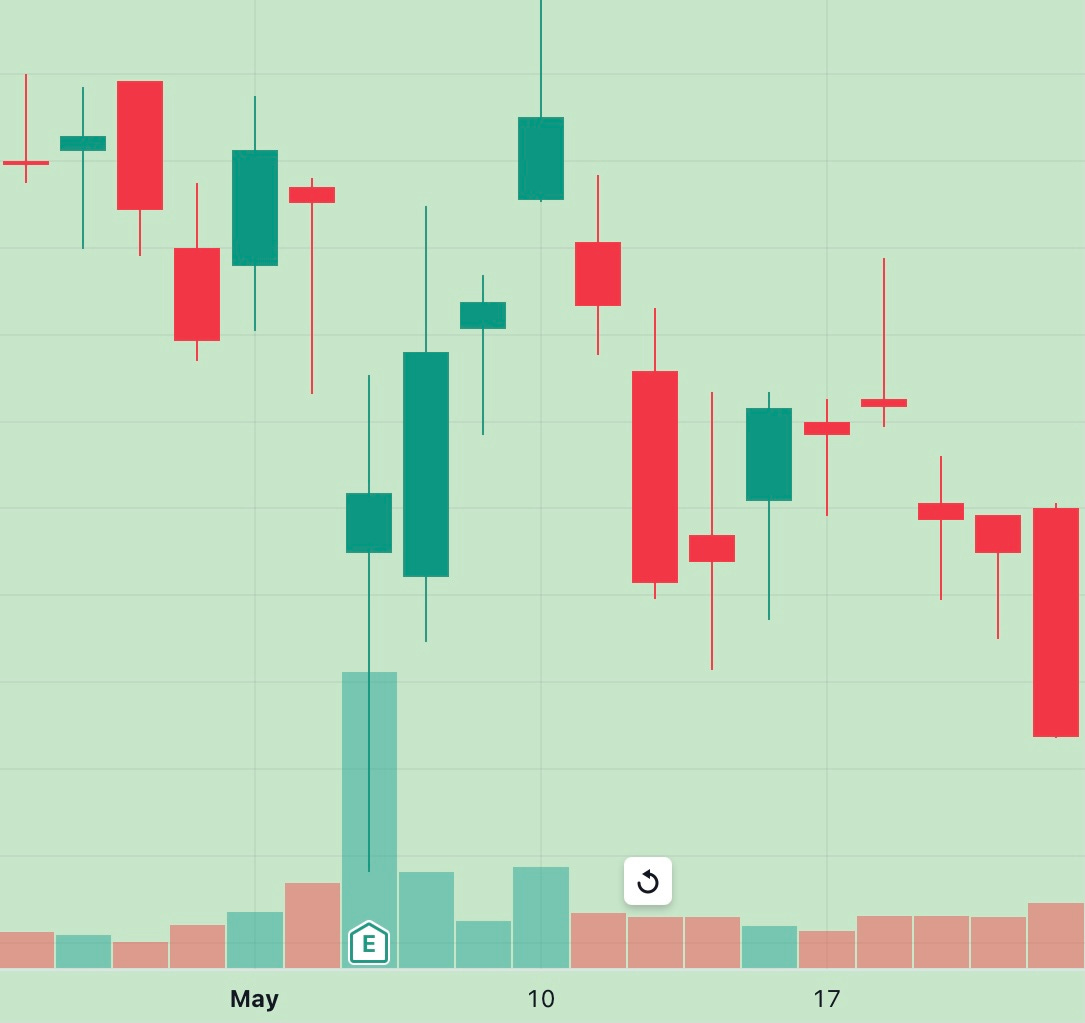
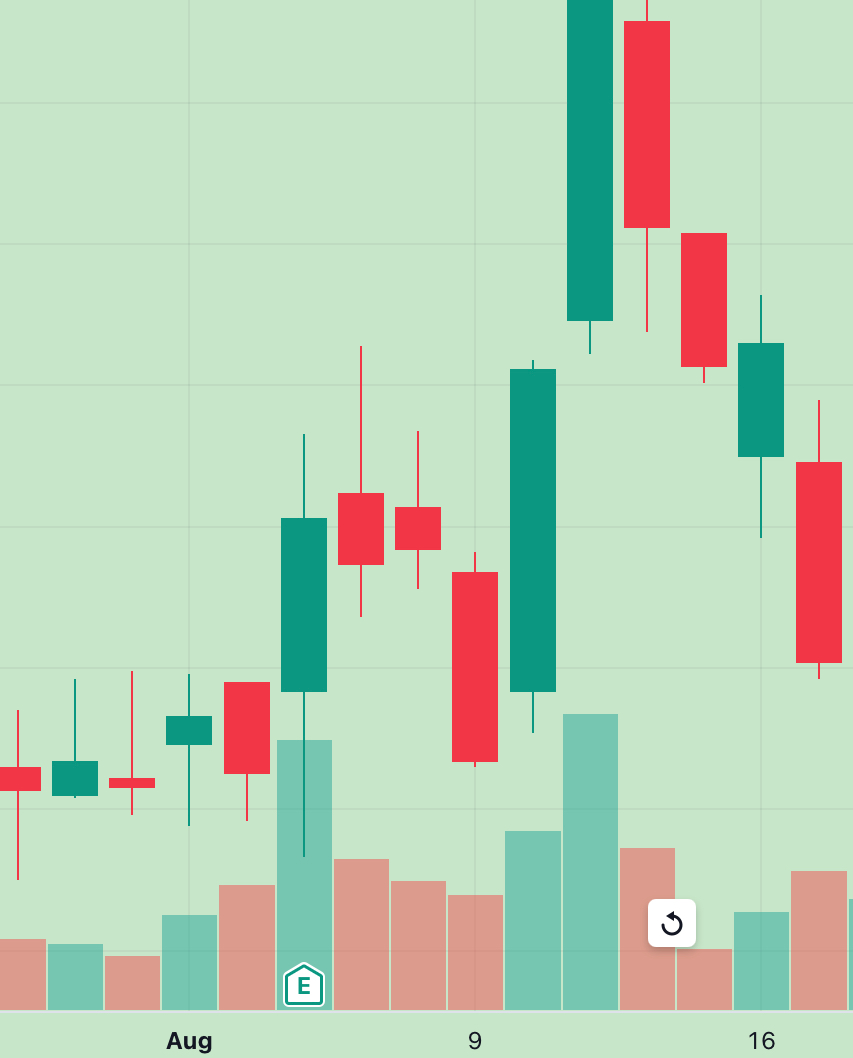
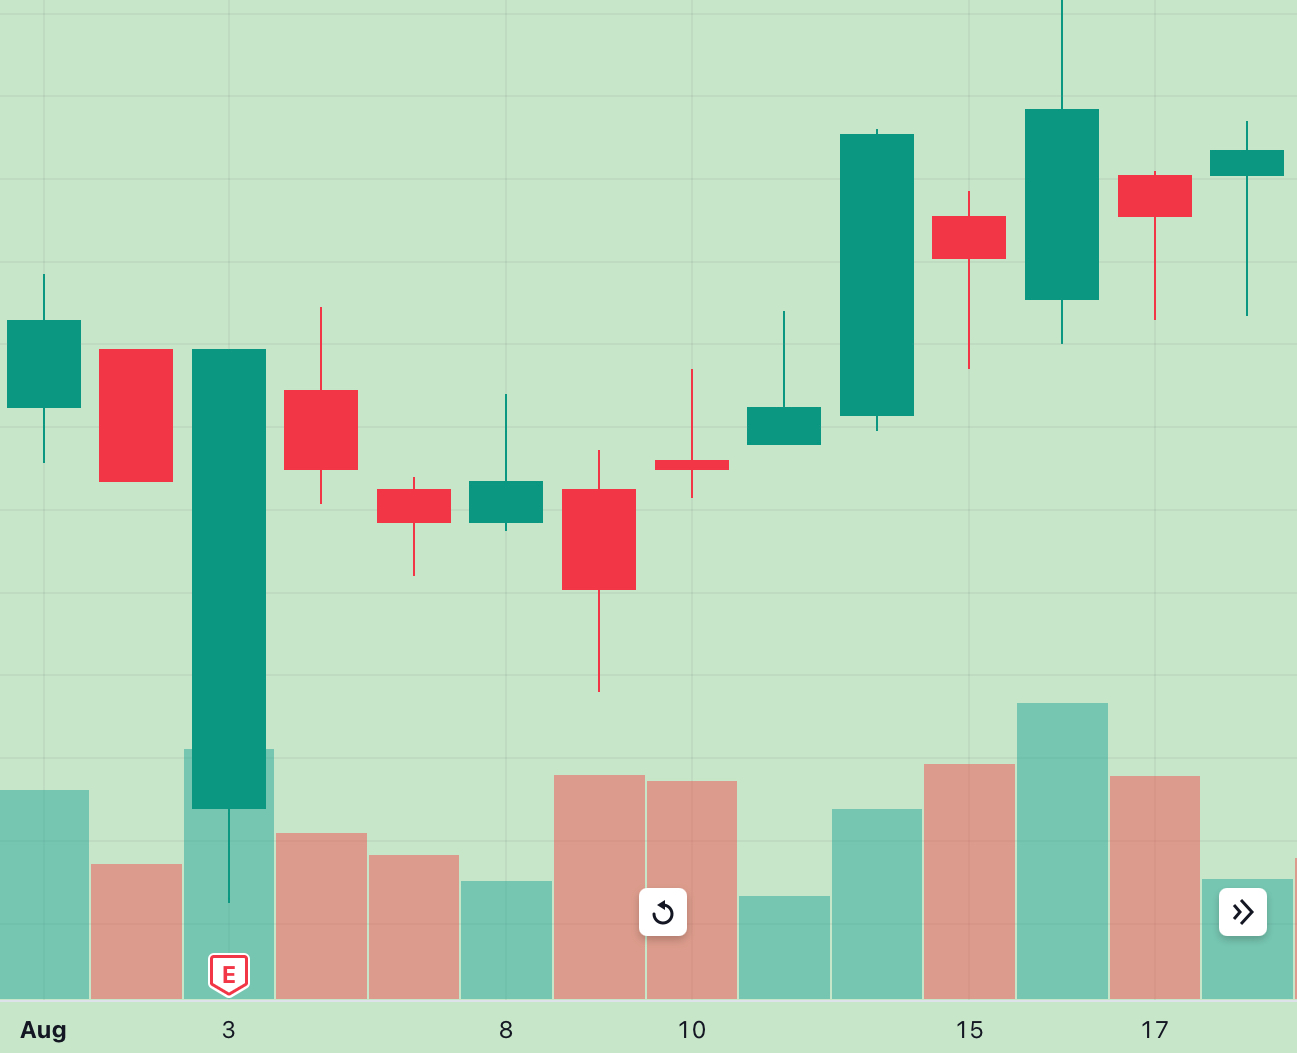
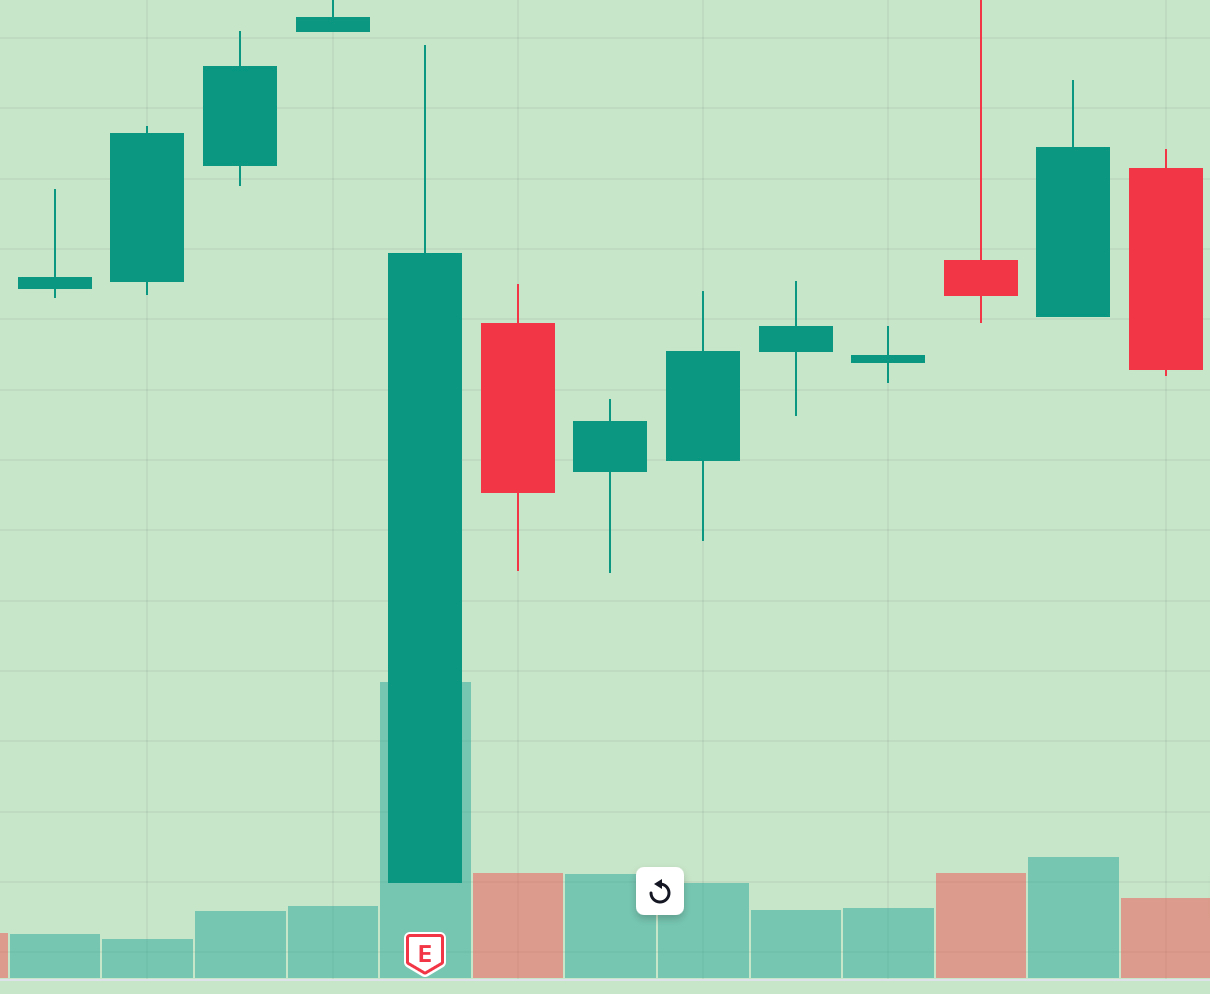
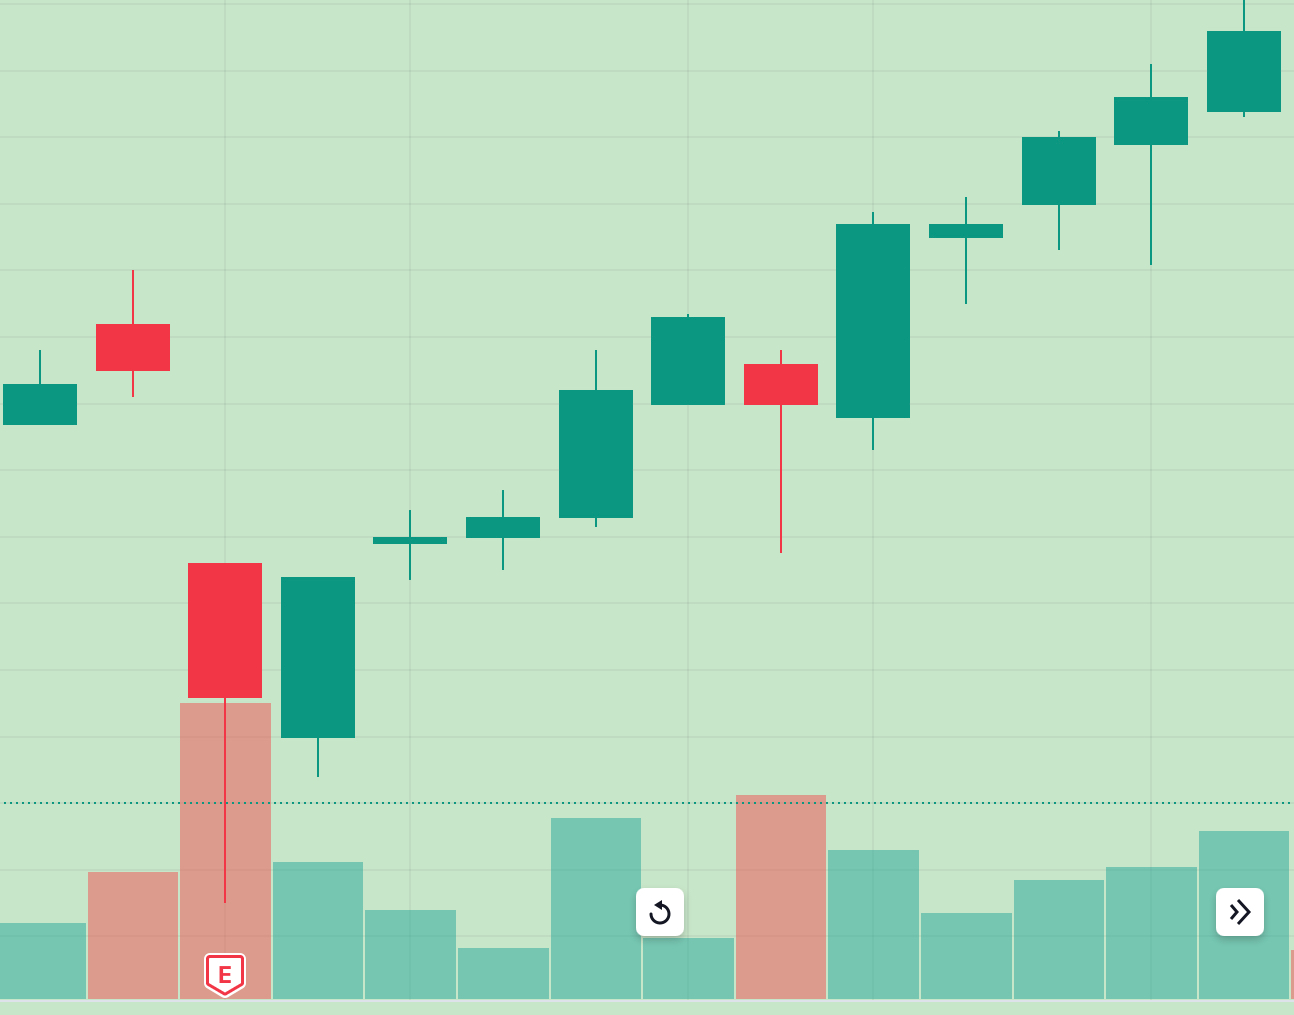
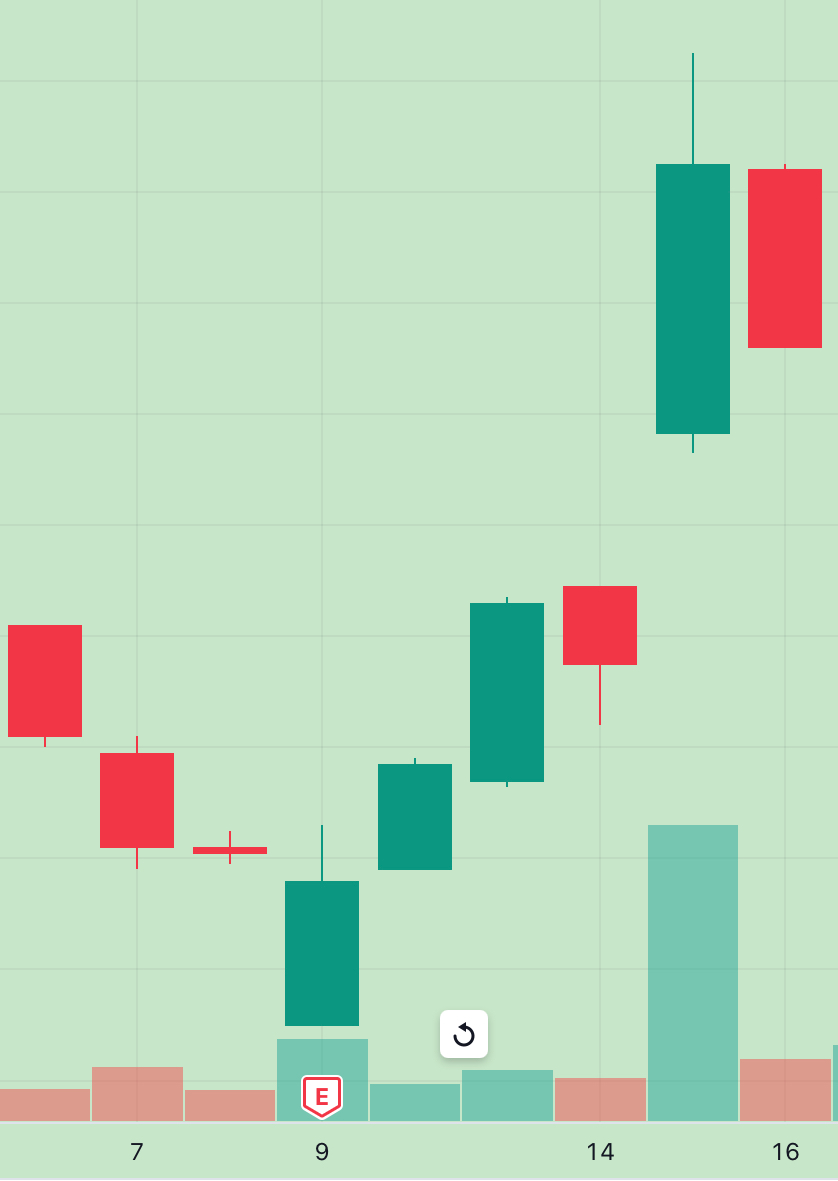
Charts below show the price action around prior quarterly reports going back 3 years.
The announcement is marked at bottom of each chart by an “E”, and next to the date I’ve noted the percentage gain from the low on earnings day to the high just days later.
August 2020, +63%
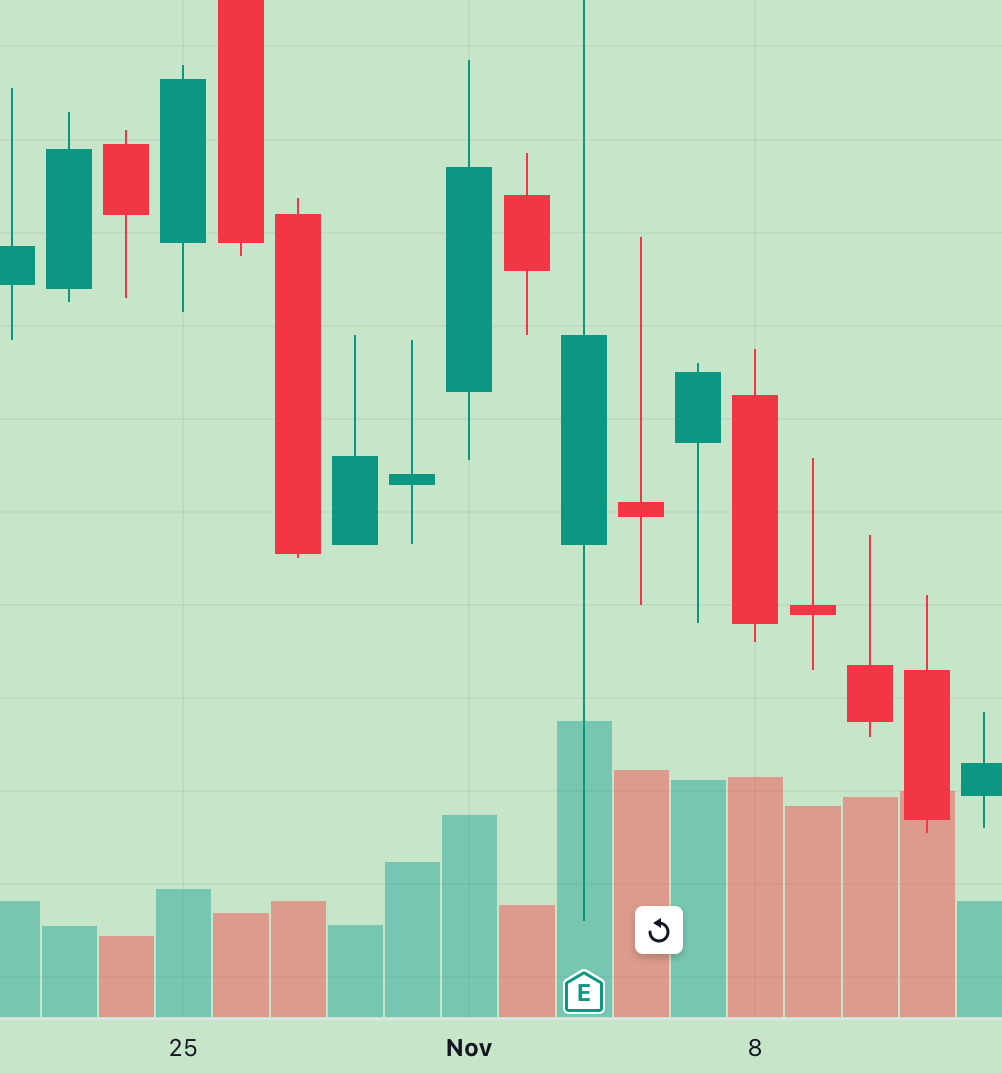
November 2020, +36%
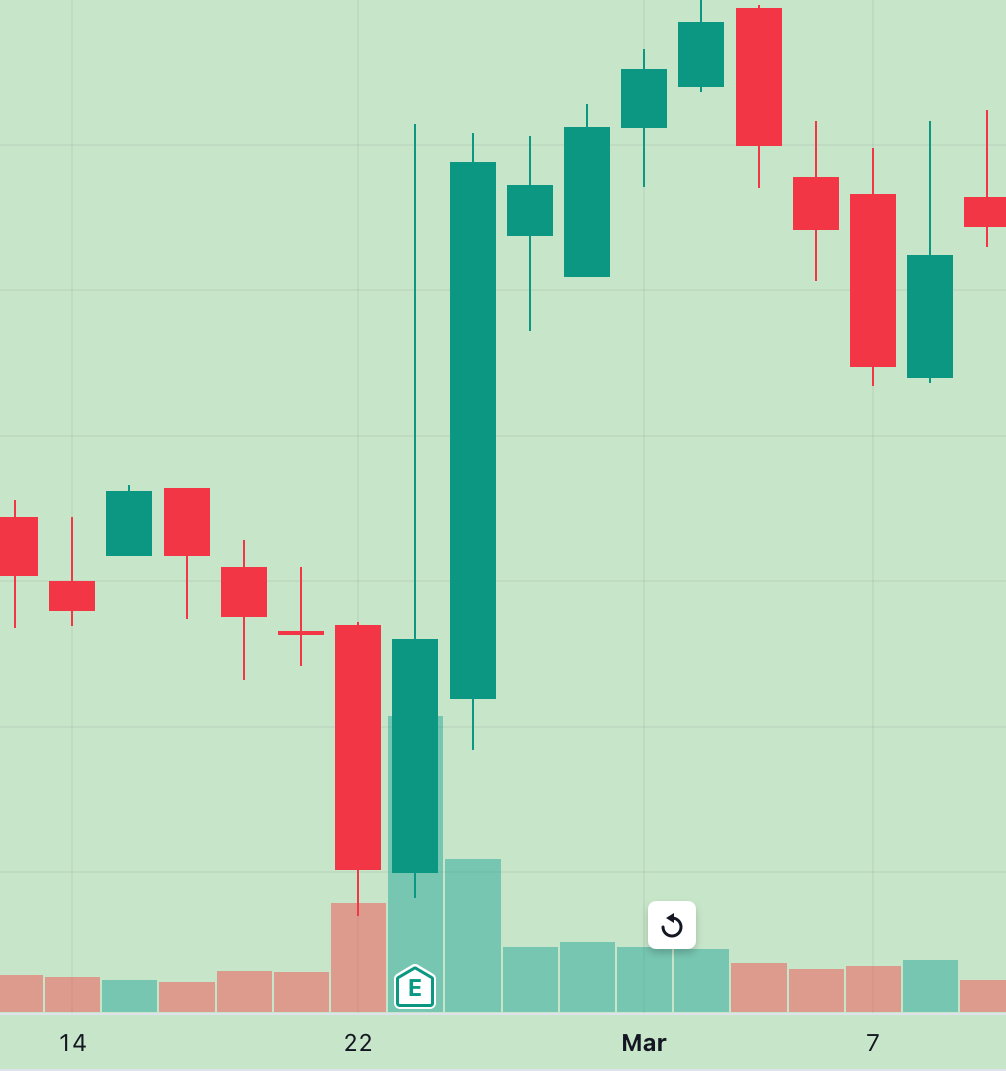
March 2021, +10%
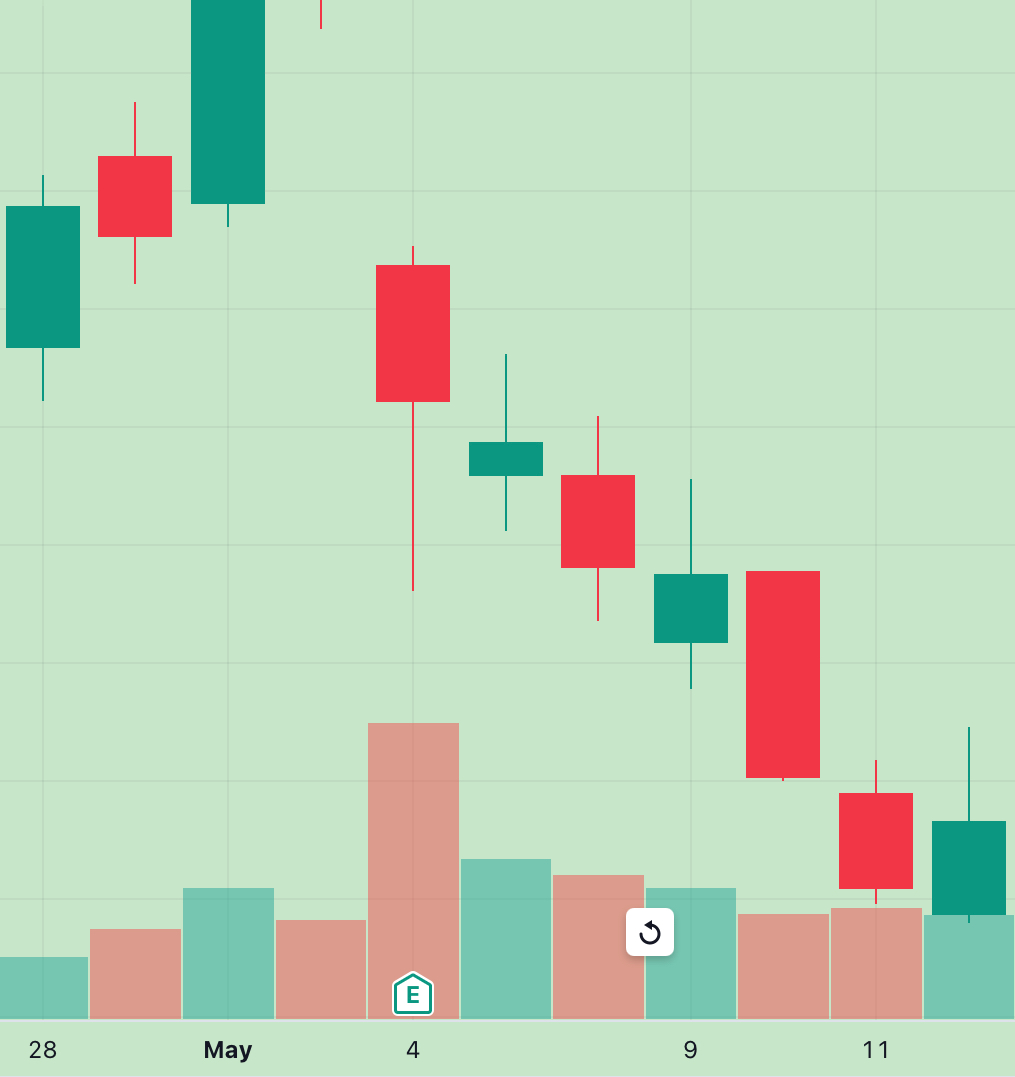
May 2021, +27%
August 2021, +17%
November 2021, +12%
February 2022, +24%
May 2022, +8%
August 2022, +27%
November 2022, +43%
March 2023, +5%
May 2023, +101%
August 2023, +57%
Average +33%
Realize those figures reflect perfect timing. In reality there’ll be no such thing, meaning some - probably several - of these would in reality be losers.
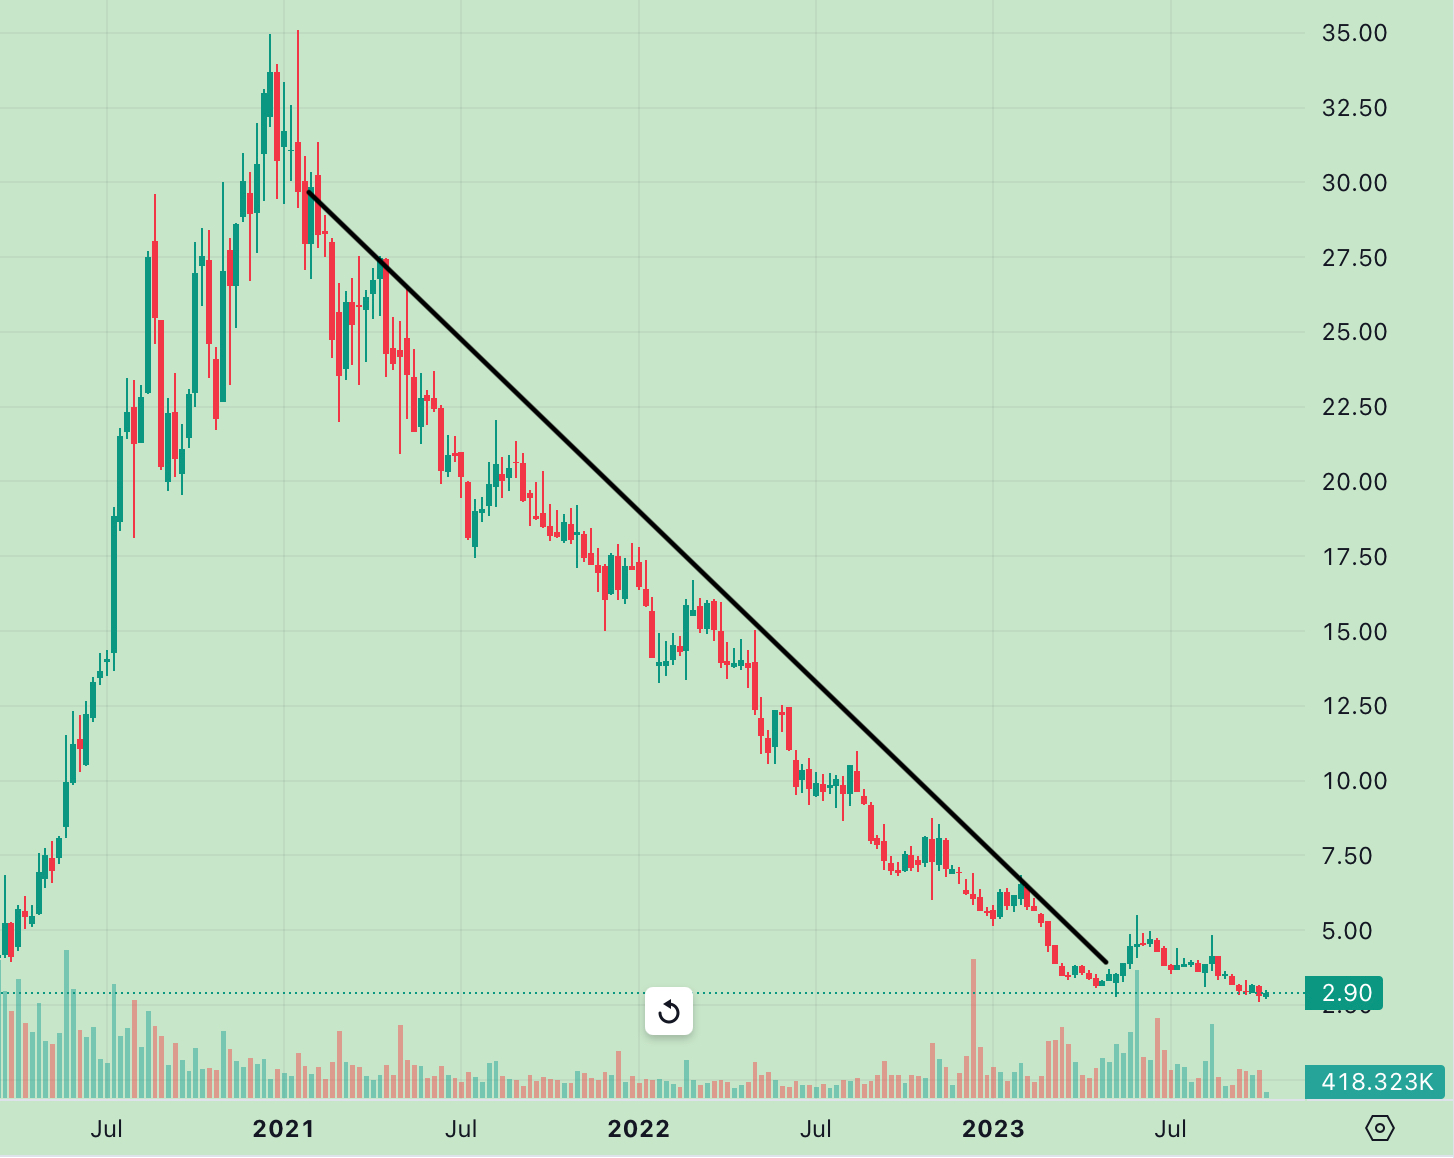
Next is a chart covering those 3 years, and in this chart we see a 2-year down trend broken. Since that break I’ve been waiting for an entry signal around the current level.
Why enter at this level?
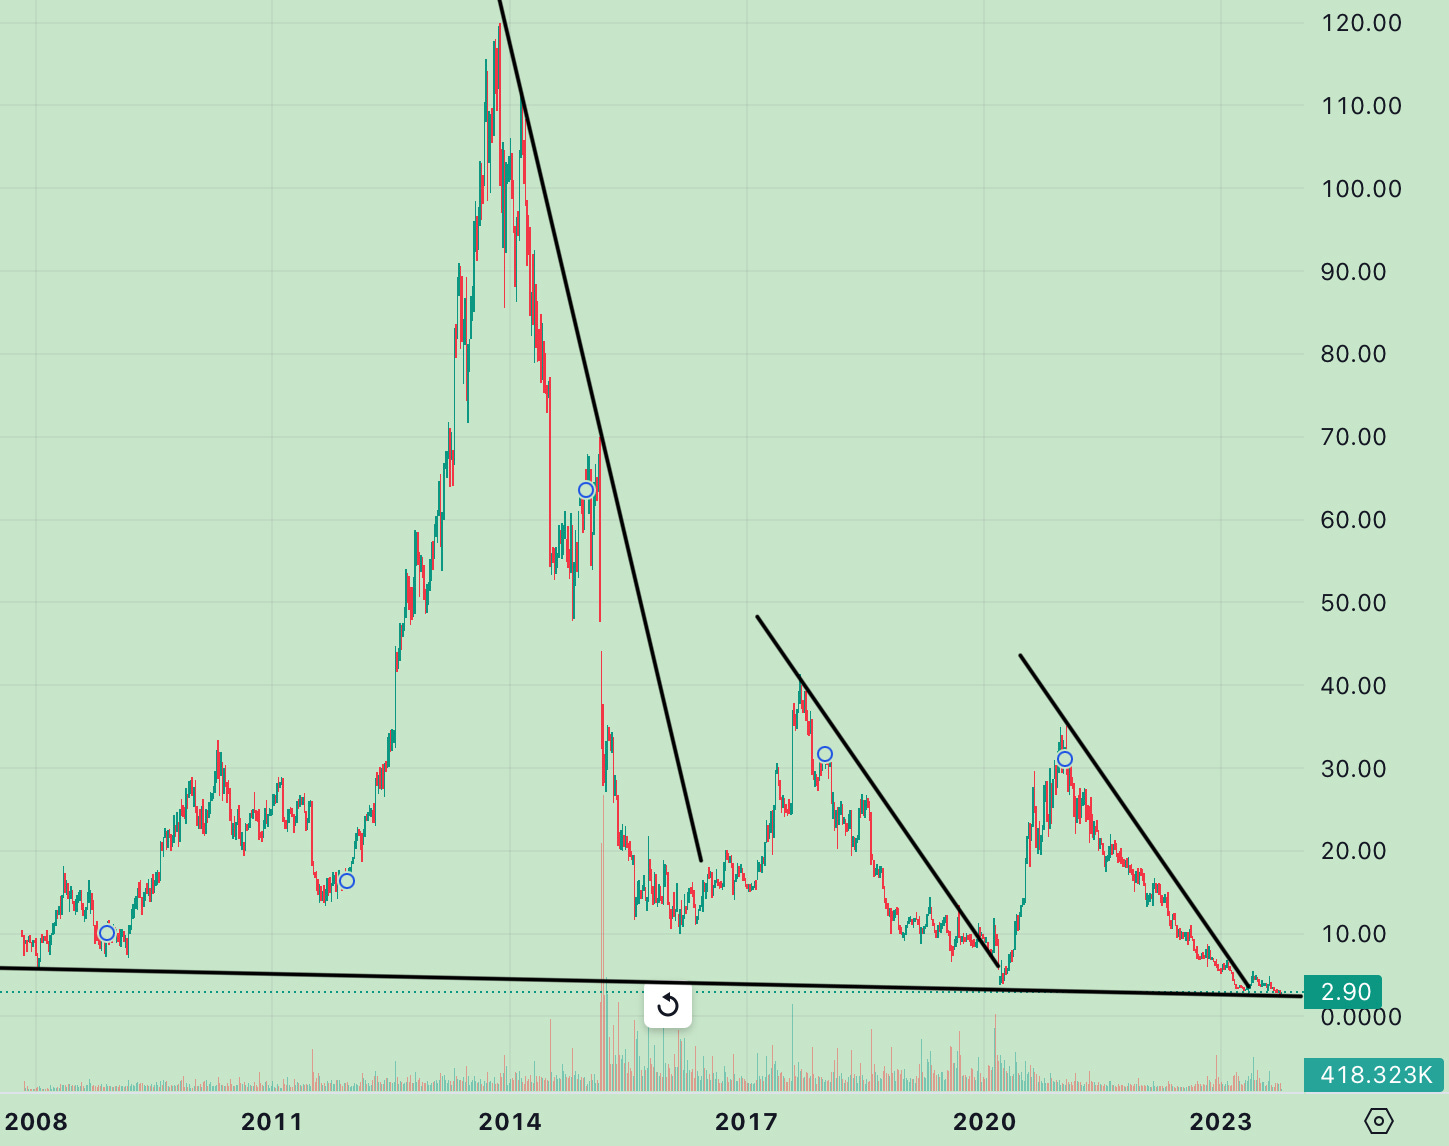
Here’s its all-time chart:
The horizontal line looks like it’s lucky for buyers, and:
28 months after its 2013 peak it bottomed 92% lower.
30 months after its 2017 peak it bottomed 93% lower.
33 months after its 2021 peak is now, and it’s 93% lower.
The major run-ups on the chart respectively: 7.2x, 4.1x, and 9.6x
Average 7x
Not bad!
Will history repeat? We’ll soon see, and I’ll be speculating on it because my timing signals for LL are likely to trigger bullish within the next month or so.
That’s only ever happened for this stock 3 times prior:
2011, with a 4.7x price increase over the following 2 years.
2016, with a 2.7x price increase over the following year.
2019, with a 3.9x price increase over the following 2 years.
The average here is just over half that of perfect timing, and that’s still presuming an exit right at the top.
If selling when my signals subsequently turned bearish we get gains of: 270%, 25%, and 116%
That’s an average 137% profit over an average holding time of just under 2 years.
Fantastic results, if not figures as eye-popping as the total swings in the shares.
A major caveat
There was no draw-down worth mention after my first two bullish signals.
However the 3rd time saw a 58% drop in price before the actual bottom 3 months later, where the massive 9.6x spike began in 2020.
Would you endure a 58% plunge over 3 months for the sake of process?
I will if need be, and I will update the process in real time.